PU Prime App
Exclusive deals on mobile


PU Prime App
Exclusive deals on mobile
一手掌握全球市场
我们的交易APP与大多数智能设备系统兼容。现在就下载该应用,即刻享受在任意设备上随时随地开展交易的乐趣。


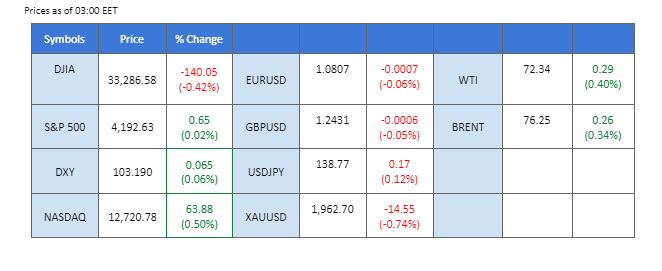
23 May 2023,05:59
Daily Market Analysis
23 May 2023, 05:59


Both President Biden and the House Speaker claimed that yesterday’s meeting on the debt-limit bill has a productive outcome but both parties are yet to come to an agreement. Meanwhile, U.S. treasury secretary Janet Yellen, reiterated that the department will run out of cash in early June. The dollar index has strengthened and is poised above $103 while the Fed continues to signal for continuous rate hikes this year while the inflation remains sticky. Elsewhere, the oil market experienced a slight rebound in the start of the week, encouraged by the optimistic news from the White House regarding the debt-ceiling bill.
Current rate hike bets on 14th June Fed interest rate decision:
Source: CME Fedwatch Tool
0 bps (85%) VS 25 bps (15%)
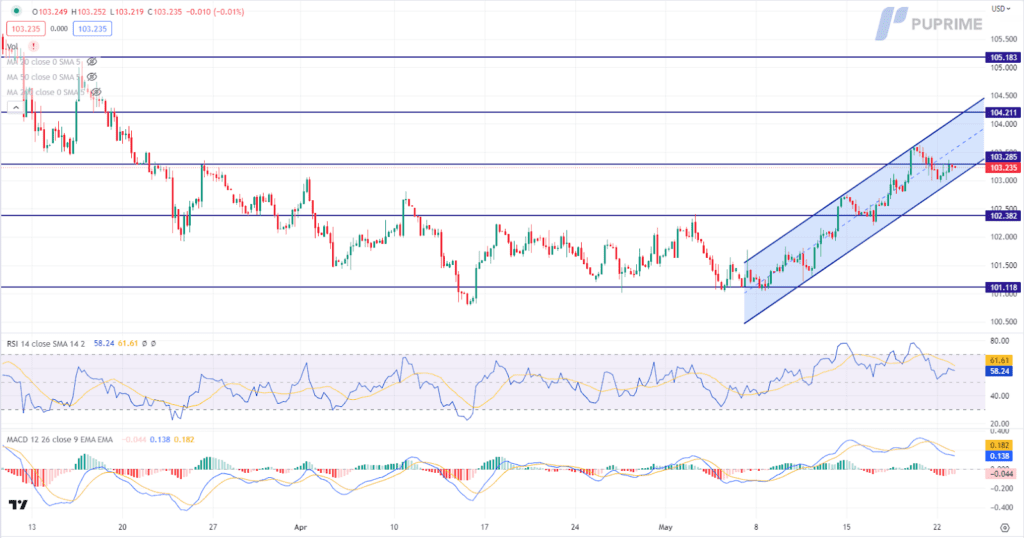
The US Dollar experienced a modest rebound in response to growing optimism regarding the ongoing debt ceiling talks. Key representatives from both political parties convened at the White House for an extensive discussion lasting over an hour. House Speaker Kevin McCarthy acknowledged the productive nature of the talks between himself and President Joe Biden. However, a conclusive agreement to avert a potentially catastrophic US debt default has yet to be reached. In addition, James Bullard, President of the Federal Reserve Bank of St. Louis, projected that the central bank would need to raise interest rates twice more within the current year to combat rising inflation, spurring further bullish momentum on the US Dollar.
The Dollar Index is trading higher while currently testing the resistance level. MACD has illustrated diminishing bearish momentum, while RSI is at 58, suggesting the index might extend its gains after breakout since the RSI stays above the midline.
Resistance level: 103.30, 104.20
Support level: 102.40, 101.10
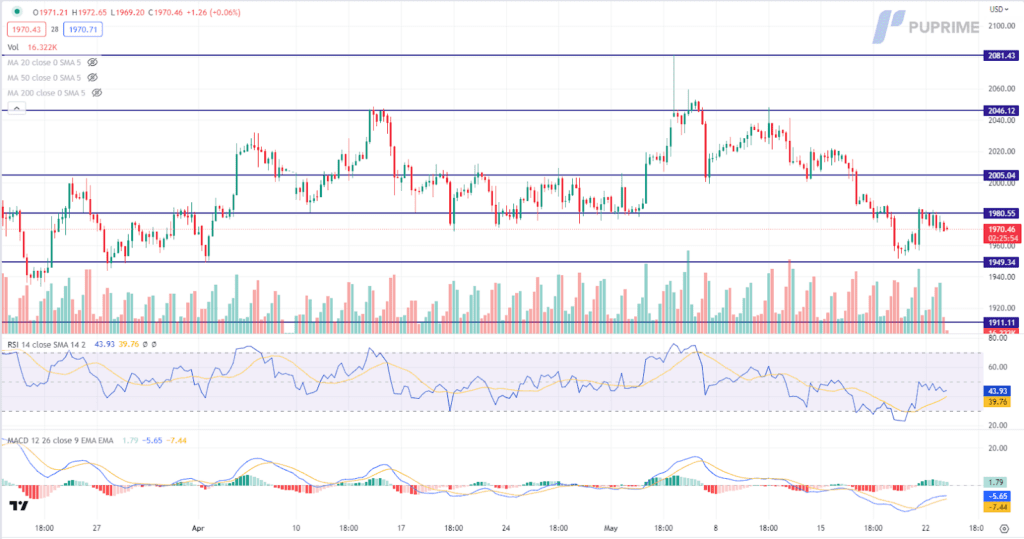
Gold prices witnessed a decline as the US Dollar strengthened, primarily driven by increasing optimism surrounding the ongoing debt ceiling talks. Evident in the extensive discussion that took place at the White House on Monday, key representatives from both political parties, including House Speaker Kevin McCarthy and President Joe Biden, expressed a positive outlook on the discussions, emphasising that the tone of the meeting was notably more favourable than in previous instances. Despite this, a definitive agreement to avert a potentially disastrous US debt default has not yet been reached. Investors are advised to continue monitoring any updates regarding the debt ceiling talks for further trading signals
Gold prices are trading lower following the prior retracement from the resistance level. MACD has illustrated diminishing bullish momentum, while RSI is at 44, suggesting the commodity might extend its losses toward support level.
Resistance level: 1980.00, 2005.00
Support level: 1950.00, 1910.00
The dollar has further strengthened, especially after the White House released optimistic news regarding the debt-limit bill. Both the U.S. president and the House Speaker claimed that the meeting has a progressive outcome but is yet to come to an agreement. On top of that, the Fed continues to signal for Hawkish monetary policy in this year as the inflation remains sticky. It is the same with the ECB; the European Central Bank continues to take on a very hawkish tone to meet the targeted inflation rate at 2%.
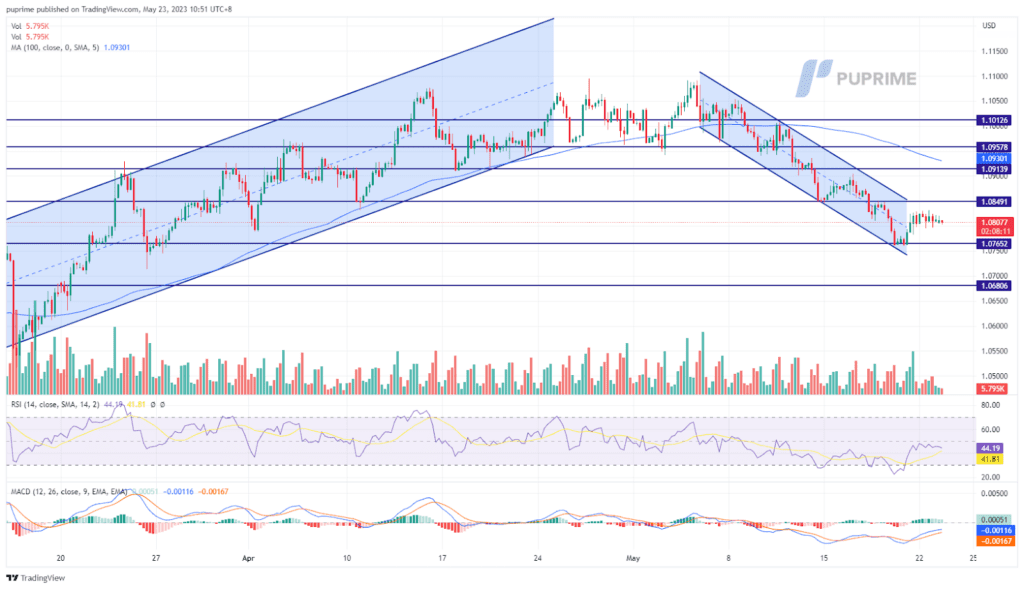
The euro has moved sideways after rebounding from its crucial support level at 1.0765. the RSI has stopped moving upward, suggesting a slow down in buying power while the MACD is moving toward the zero line suggesting the bullish momentum is forming.
Resistance level: 1.0850, 1.0914
Support level: 1.0765, 1.0681
The Japanese Yen experienced bearish momentum against the US Dollar throughout the year, hitting its lowest levels as investors placed their bets on a potential shift in central bank policies. This decline can be attributed to a combination of factors, including a widening yield spread between the United States and Japan and contrasting monetary policy stances. While several Federal Reserve members adopted a hawkish tone, signalling a possible tightening of monetary policy, the Bank of Japan remains committed to maintaining its accommodative stance to stimulate economic growth. This divergence in central bank approaches has further fueled the downward pressure on the Japanese Yen.
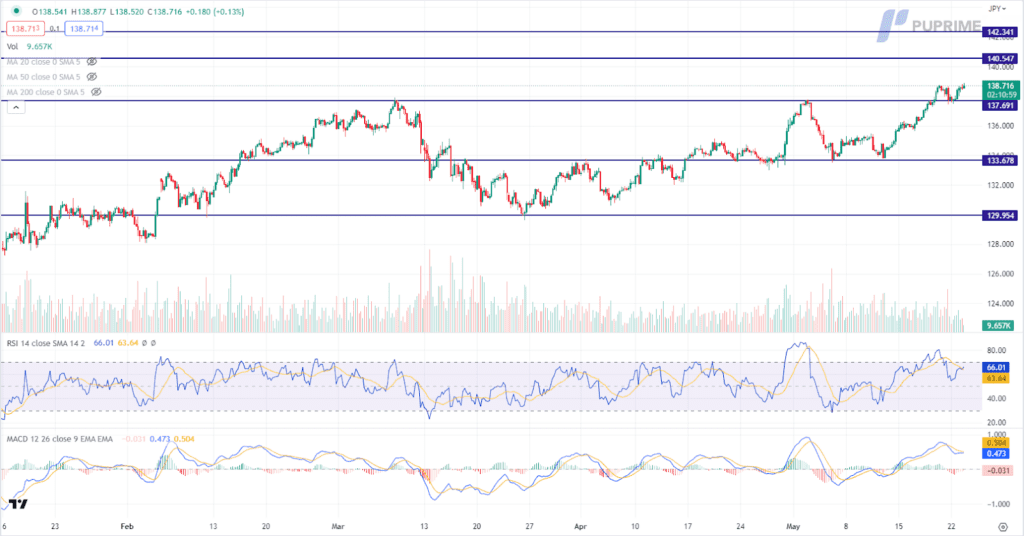
USD/JPY is trading higher following the prior breakout above the previous resistance level. MACD has illustrated diminishing bearish momentum, while RSI is at 66, suggesting the pair might extend its gains as the RSI stays above the midline.
Resistance level: 140.55, 142.35
Support level: 137.70, 133.70
The British pound has been trading within a narrow range and experienced a slight decline due to the lack of decision-making during the meeting between President Biden and Speaker McCarthy. The market remains in a state of observation, eagerly awaiting a more definitive agreement on the debt ceiling issue. This cautious approach has made the pound trade sideways as investors seek clarity and direction. In the meantime, market participants are advised to focus on today’s UK economic data, as it has the potential to provide insights and drive further price movement in the pound. By closely monitoring these economic indicators, investors can make more informed decisions in their trading activities.
The overall trend for the pound currently leans towards a neutral-bearish sentiment, reflecting the cautious market sentiment and lack of decisive direction. Traders are advised to closely monitor key developments and upcoming events that may influence the pound’s trajectory to adjust their trading strategies accordingly.
Resistance level: 1.2540, 1.2680
Support level: 1.2345, 1.2145
The Dow Jones Industrial Average remained stagnant as investors exercised caution in light of the upcoming discussions surrounding the US debt ceiling. The meeting between President Joe Biden and top congressional Republican Kevin McCarthy, aimed at addressing the issue just 10 days before a possible unprecedented default, failed to yield any consensus thus far, although both parties expressed optimism regarding the meeting’s prospects. In the interim, market participants are advised to closely monitor forthcoming US economic data, particularly statements from Federal Reserve members, and key indicators such as the Personal Consumption Expenditure (PCE) index for further trading signals.
The Dow is trading flat while currently near the support level. MACD has illustrated diminishing bullish momentum, while RSI is at 46, suggesting the index might extend its losses after breakout since the RSI stays below the midline.
Resistance level: 34210, 35450
Support level: 32950, 31660
Oil prices experience an upward trend driven by robust demand and limited supply. The International Energy Agency (IEA) warns of a potential oil shortage in the latter part of the year, projecting that demand will surpass available supply by approximately 2 million barrels daily. However, concerns arose as President Joe Biden and House Speaker Kevin McCarthy failed to reach an agreement during their meeting, heightening the risk of a potential default. These contrasting factors create a mixed sentiment in the oil market, prompting investors to monitor developments and adjust their strategies accordingly closely.
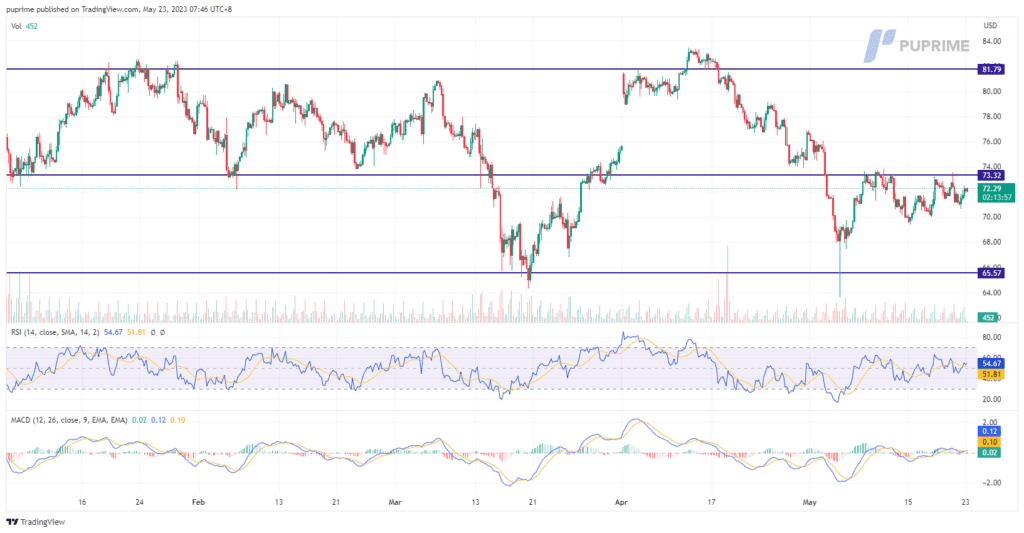
The overall trend for oil in the market is leaning towards a neutral-bullish sentiment. However, the direction of oil prices hinges heavily on the updates and progress made in the ongoing debt ceiling negotiations. Investors are advised to closely monitor the updates surrounding the debt ceiling deal as they assess and navigate their trading strategies in this uncertain environment.
Resistance level: 73.32, 81.85
Support level: 65.57, 57.39

以行业低点差和闪电般的执行速度交易外汇、指数、贵金属等。
PU Prime App - 让您优越交易


Risk Warning: Trading Contract for Difference (CFD) carries a high level of risk to your capital and may result in losses that exceed your deposits due to leverage. It's important to understand how CFDs work and assess whether you can afford the high risk of losing your money. When acquiring our derivative products, you do not own or have rights in the underlying assets. Past performance is not indicative of future results. The information on this website is general and does not take into account your personal objectives, financial circumstances, or needs. Seek independent advice from qualified experts if necessary, and ensure you fully understand the risks before making any trading decisions.
PU Prime is a brand name of different entities authorised and registered in various jurisdictions.
PU Prime Limited is authorized and regulated by the Financial Services Authority of Seychelles under License No. SD050, with registered address at CT House, Office 1A, Providence, Mahe, Seychelles.
PU Prime Ltd is authorized and regulated by the Financial Services Commission of Mauritius under License No. GB23202672, with registered address at Suite 201 Level 2, The Catalyst Building, 40 Silicon Avenue, Cybercity Ebene, Mauritius.
PU Prime (Pty) Ltd is an authorised Financial Services Provider registered and regulated by the Financial Sector Conduct Authority of South Africa under License No. 52218, with registered address at 37 Harley Street, Ferndale, Randburg, Gauteng, South Africa.
The information on this website is not intended for residents of certain jurisdictions, including the United States, Singapore, Australia, China, Russia, and jurisdictions listed on the FATF and EU/UN sanctions lists. It is not intended for distribution or use where such distribution or use would be contrary to local law or regulation. While the Authority has granted a securities or derivatives investment business licence to the Licensee, it does not endorse the products offered.
Finzero Cap Ltd, registered in the Republic of Cyprus with registration number HE414308 and registered address at 62 Athalassas, Mezzanine, Strovolos 2012, Nicosia, Cyprus.
Copyright © 2024 PU Prime.

Please note the Website is intended for individuals residing in jurisdictions where accessing the Website is permitted by law.
Please note that PU Prime and its affiliated entities are neither established nor operating in your home jurisdiction.
By clicking the "Acknowledge" button, you confirm that you are entering this website solely based on your initiative and not as a result of any specific marketing outreach. You wish to obtain information from this website which is provided on reverse solicitation in accordance with the laws of your home jurisdiction.
Thank You for Your Acknowledgement!
Ten en cuenta que el sitio web está destinado a personas que residen en jurisdicciones donde el acceso al sitio web está permitido por la ley.
Ten en cuenta que PU Prime y sus entidades afiliadas no están establecidas ni operan en tu jurisdicción de origen.
Al hacer clic en el botón "Aceptar", confirmas que estás ingresando a este sitio web por tu propia iniciativa y no como resultado de ningún esfuerzo de marketing específico. Deseas obtener información de este sitio web que se proporciona mediante solicitud inversa de acuerdo con las leyes de tu jurisdicción de origen.
Thank You for Your Acknowledgement!

