PU Prime App
Exclusive deals on mobile


PU Prime App
Exclusive deals on mobile
一手掌握全球市场
我们的交易APP与大多数智能设备系统兼容。现在就下载该应用,即刻享受在任意设备上随时随地开展交易的乐趣。


30 June 2023,05:44
Daily Market Analysis
30 June 2023, 05:44

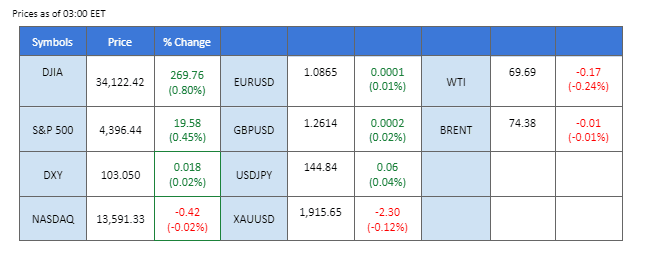
The US Dollar has gained strength as economic data surpassed expectations. Meanwhile, the robust banking sector sparked bullish momentum in the US equity market. The Federal Reserve’s stress test results showcased the resilience of major banks, including Wells Fargo, JPMorgan Chase, and Goldman Sachs. Additionally, positive indicators in the form of solid GDP growth and a declining number of Americans filing for unemployment benefits further highlighted the vitality of the US economy. Crude oil prices surged after a substantial weekly drawdown in US crude stocks, reflecting encouraging demand. Japanese yen dipped as downbeat inflation data from Japan reinforced the Bank of Japan’s expectations to maintain its quantitative easing program. Investors are advised to closely focus on the forthcoming PCE Index figures, which will provide crucial trading signals.
Current rate hike bets on 26th July Fed interest rate decision:
Source: CME Fedwatch Tool
0 bps (11%) VS 25 bps (89%)
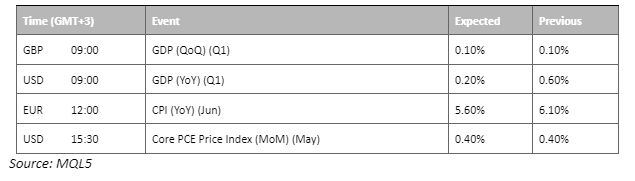
The US Dollar continues to exhibit bullish momentum, supported by a series of encouraging economic data. Notably, the US GDP for the recent period came in at a solid 2.0%, surpassing market expectations of 1.40%. This robust growth figure demonstrates the resilience and vitality of the US economy. Another positive indicator for the US economy lies in the declining number of Americans filing new claims for unemployment benefits. Last week witnessed the most substantial drop in initial jobless claims in 20 months, highlighting the economy’s resilience. The figure decreased from the previous reading of 265,000 to 239,000, surpassing market expectations of 266,000.
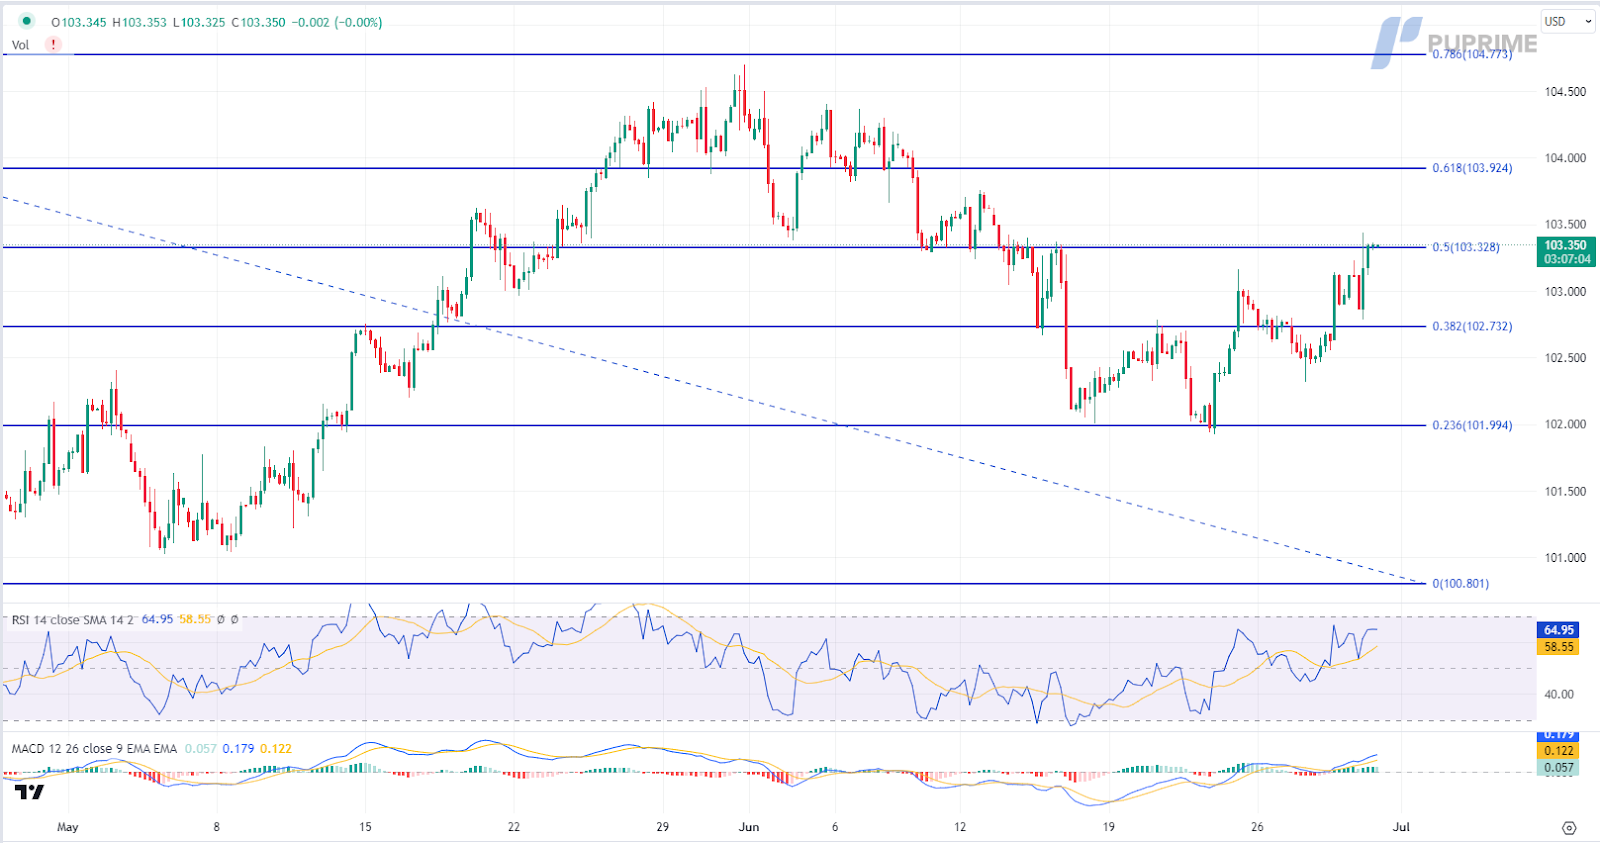
The dollar index is trading higher while currently testing the resistance level at 103.35. MACD has illustrated increasing bullish momentum, while RSI is at 65, suggesting the index might extend its gains after breakout since the RSI stays above the midline.
Resistance level: 103.35, 103.90
Support level: 102.75, 102.00

The gold market experienced a notable slump as it grappled with the influence of upbeat economic data emanating from the United States. This development, accompanied by a sparkling bullish momentum surrounding the US Dollar, exerted downward pressure on dollar-denominated gold. However, with the impending release of the PCE Index data, the overall trajectory for gold remains shrouded in uncertainty. Consequently, investors are urged to diligently focus on the forthcoming PCE Index figures, which will serve as a critical barometer for assessing the potential movements within the gold market.
Gold prices are trading lower while currently testing the support level. However, MACD has illustrated diminishing bearish momentum, while RSI is at 43, suggesting the commodity might be traded higher as technical correction since the RSI rebounded sharply from oversold territory.
Resistance level: 1930.00, 1950.00
Support level: 1900.00, 1865.00
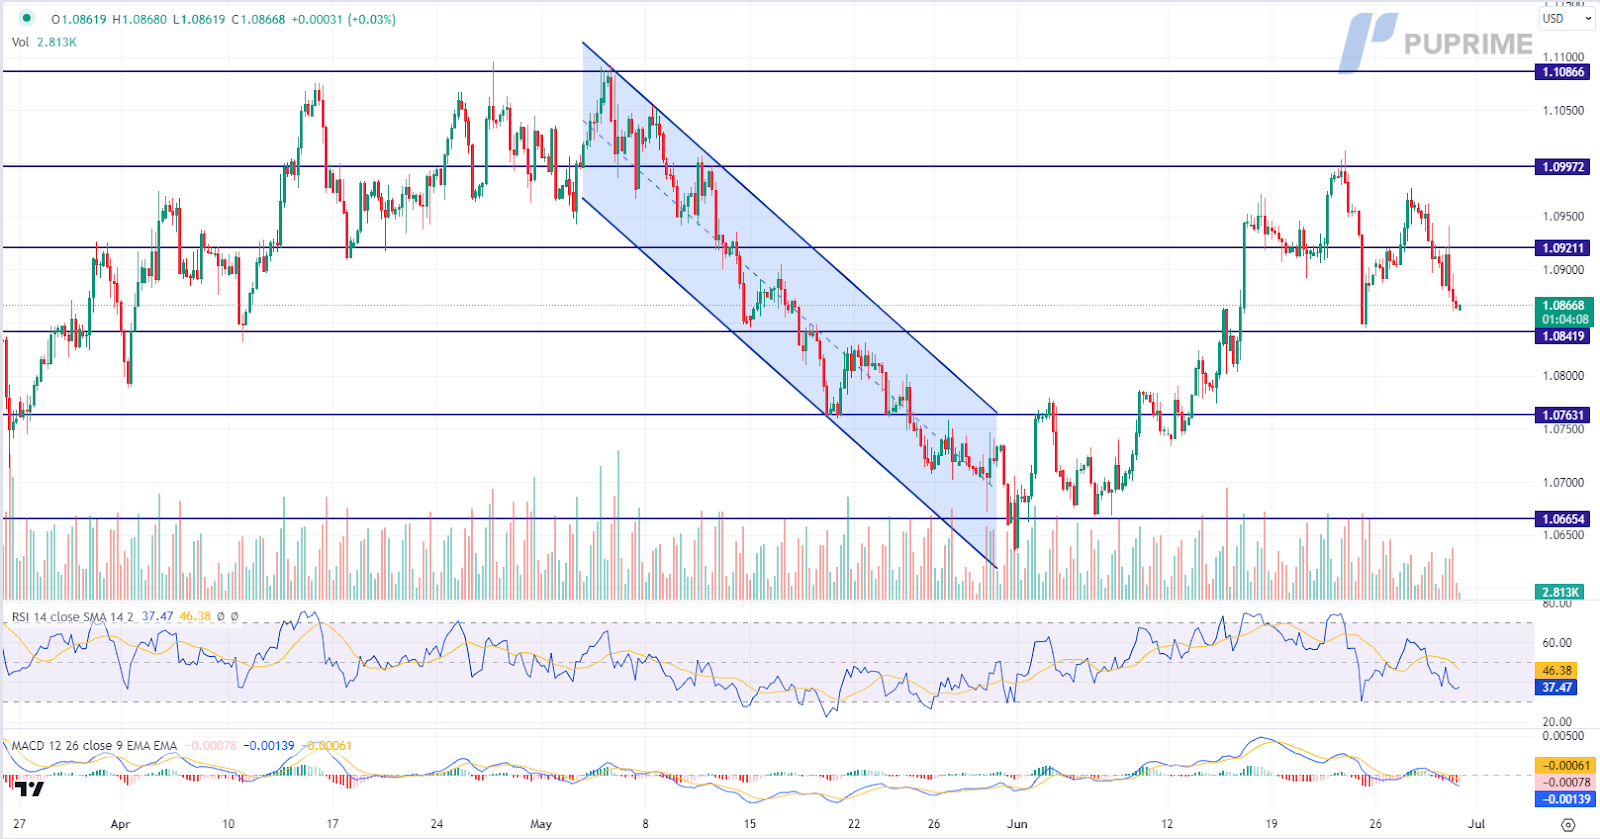
EUR/USD experienced a slight retreat amid the strengthening US Dollar, primarily due to the lack of market catalysts from the EU region. However, the Euro’s losses were limited by high inflation data, with German consumer prices surpassing market expectations, rising by 6.80% on a yearly basis in June. This robust inflation data from Germany, the largest economy in the eurozone, strengthens the possibility of the European Central Bank (ECB) tightening its monetary cycle in the future.
EUR/USD is trading lower while currently testing the support level. MACD has illustrated increasing bearish momentum, while RSI is at 37, suggesting the pair might extend its losses after breakout since the RSI stays below the midline
Resistance level: 1.0920, 1.0995
Support level: 1.0840, 1.0765
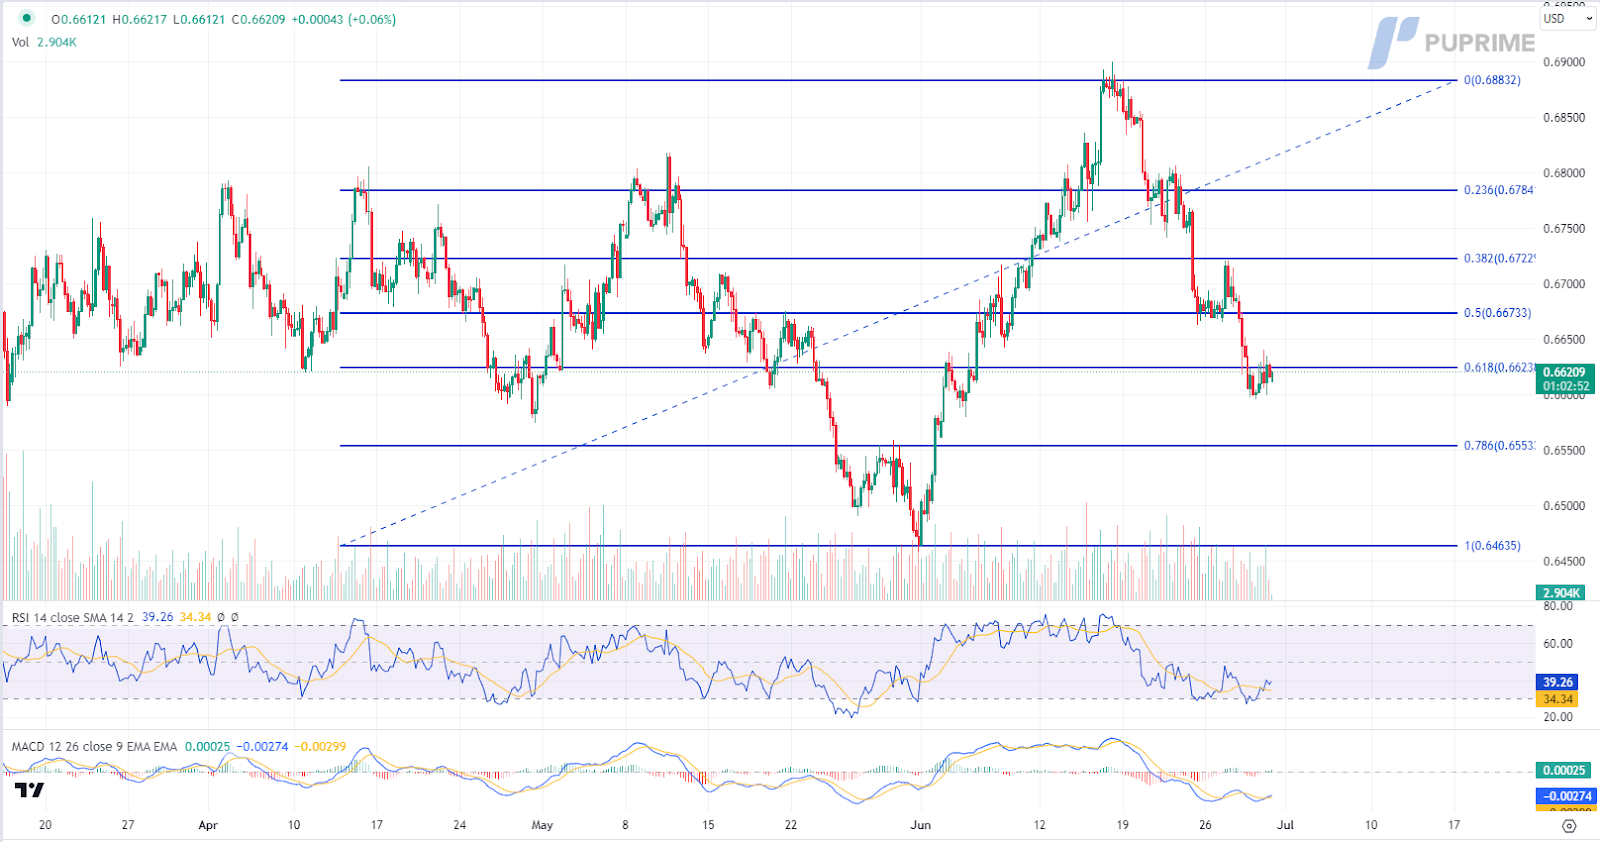
Despite a rebound from fresh weekly lows, the long-term trend for the AUD/USD pair remains pessimistic due to the continued strength of the US Dollar. Market focus now shifts to the upcoming interest rate decisions by the Reserve Bank of Australia (RBA) next Tuesday. While markets anticipate a dovish stance and no change in the cash rate, the tight labour market and elevated inflation leave room for potential policy adjustments, introducing an element of uncertainty for the pair.
AUD/USD is trading higher while currently testing the resistance level. MACD has illustrated increasing bullish momentum, while RSI is at 39, suggesting the pair might extend its gains after breakout since the RSI rebounded sharply from oversold territory.
Resistance level: 0.6625, 0.6675
Support level: 0.6555, 0.6465

The Japanese Yen continued to slump following the release of downbeat inflation data, as Japan’s Tokyo Core Consumer Price Index (CPI) fell short of market expectations at 3.2% year-on-year. The disappointing inflation report reinforced the belief that the Bank of Japan will maintain its quantitative easing program, widening the yield spread between Japan and other hawkish major central banks like the Federal Reserve and the ECB.
USD/JPY is trading higher while currently testing the resistance level. However, MACD has illustrated diminishing bullish momentum, while RSI is at 76, suggesting the pair might enter overbought territory.
Resistance level: 145.35, 150.15
Support level: 141.60, 138.95
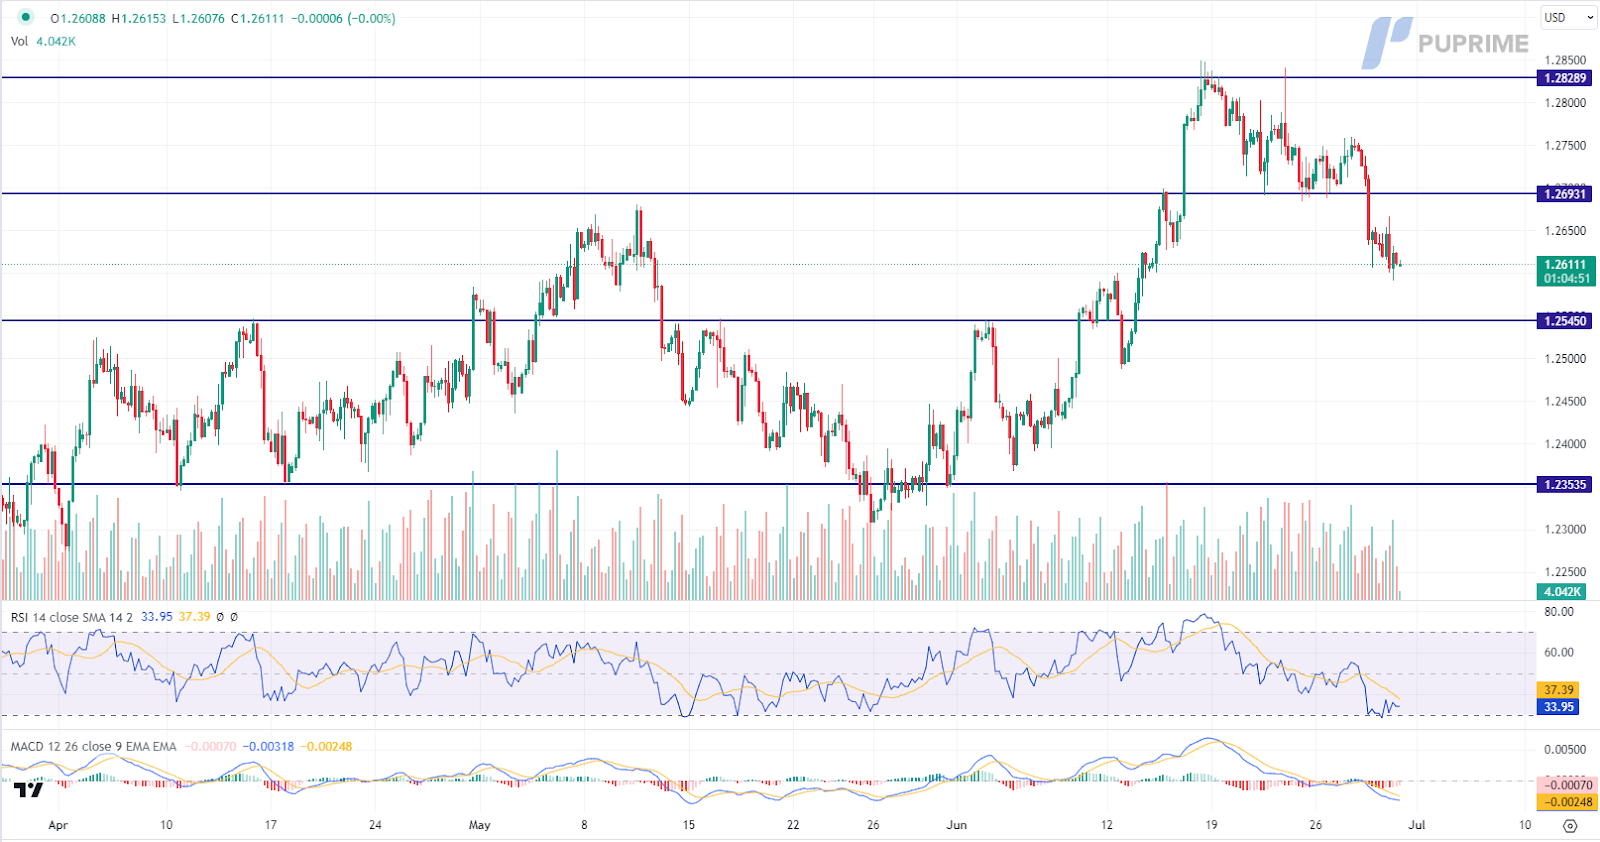
The bearish momentum in the GBP/USD pair can be attributed to the strength of the US Dollar, as the UK region lacks significant market catalysts. The recent positive economic data from the United States has surpassed expectations, leading investors to reevaluate the likelihood of a more aggressive rate hike from the US.
GBP/USD is trading lower following the prior breakout below the previous support level. However, MACD has illustrated diminishing bearish momentum, while RSI is at 34, suggesting the pair might enter oversold territory.
Resistance level: 1.2695, 1.2830
Support level: 1.2545, 1.2355

The Federal Reserve’s stress test results have bolstered confidence in the US banking industry, propelling the Dow to surge. Wells Fargo & Company, JPMorgan Chase & Co, and Goldman Sachs Group Inc led the rally, highlighting the strength of major banks. This optimistic outlook stems from the stress test’s findings, indicating that 23 of the largest US lenders possess the resilience to withstand even a severe recession scenario.
The Dow is trading higher while currently testing the resistance level. MACD has illustrated diminishing bearish momentum, while RSI is at 58, suggesting the index might extend its gains after breakout the resistance level since the RSI stays above the midline.
Resistance level: 34210.00, 34835.00
Support level: 33685.00, 33155.00
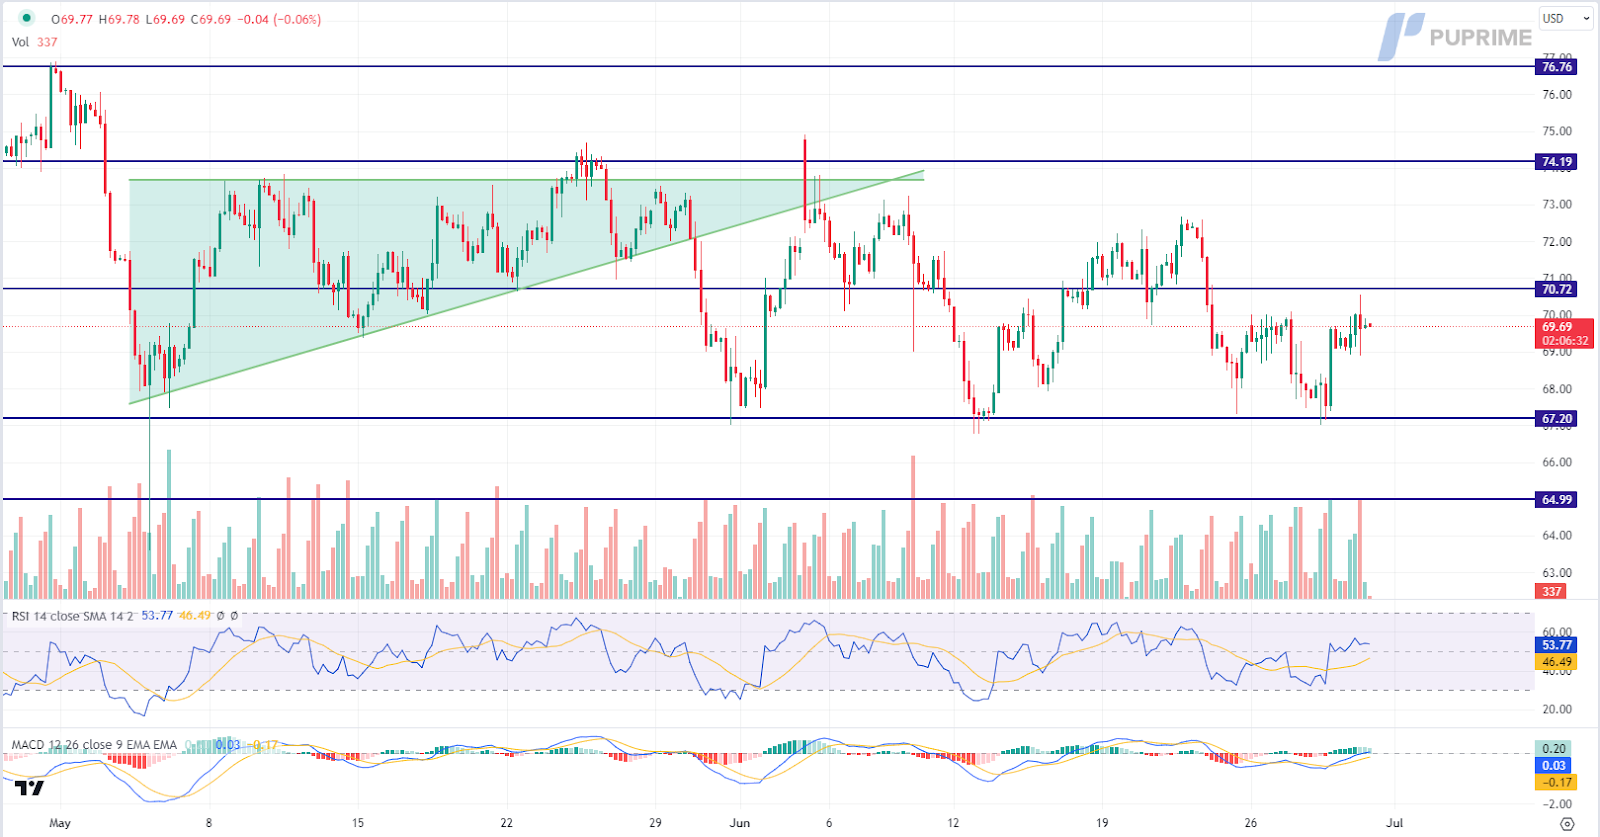
Crude oil prices extended their upward trajectory for a second consecutive day, propelled by investors digesting a substantial weekly decline in US crude stocks. This drawdown served as a positive signal, reflecting an encouraging demand for the coveted black commodity. While the recent rate hike decisions by global central banks have introduced an element of uncertainty, the resilient nature of economic growth persists. Consequently, investors find themselves grappling with a dilemma: whether to prioritise the prospects of robust economic expansion or the implications of a tightening monetary cycle when considering entry into the oil market
Oil prices are trading higher while currently testing the resistance level. However, MACD has illustrated diminishing bullish momentum. On the other hand, RSI is at 54, suggesting the commodity might extend its gains after breakout since the RSI stays above the midline.
Resistance level: 70.70, 74.20
Support level: 67.20, 65.00

以行业低点差和闪电般的执行速度交易外汇、指数、贵金属等。
PU Prime App - 让您优越交易


Risk Warning: Trading Contract for Difference (CFD) carries a high level of risk to your capital and may result in losses that exceed your deposits due to leverage. It's important to understand how CFDs work and assess whether you can afford the high risk of losing your money. When acquiring our derivative products, you do not own or have rights in the underlying assets. Past performance is not indicative of future results. The information on this website is general and does not take into account your personal objectives, financial circumstances, or needs. Seek independent advice from qualified experts if necessary, and ensure you fully understand the risks before making any trading decisions.
PU Prime is a brand name of different entities authorised and registered in various jurisdictions.
PU Prime Limited is authorized and regulated by the Financial Services Authority of Seychelles under License No. SD050, with registered address at CT House, Office 1A, Providence, Mahe, Seychelles.
PU Prime Ltd is authorized and regulated by the Financial Services Commission of Mauritius under License No. GB23202672, with registered address at Suite 201 Level 2, The Catalyst Building, 40 Silicon Avenue, Cybercity Ebene, Mauritius.
PU Prime (Pty) Ltd is an authorised Financial Services Provider registered and regulated by the Financial Sector Conduct Authority of South Africa under License No. 52218, with registered address at 37 Harley Street, Ferndale, Randburg, Gauteng, South Africa.
The information on this website is not intended for residents of certain jurisdictions, including the United States, Singapore, Australia, China, Russia, and jurisdictions listed on the FATF and EU/UN sanctions lists. It is not intended for distribution or use where such distribution or use would be contrary to local law or regulation. While the Authority has granted a securities or derivatives investment business licence to the Licensee, it does not endorse the products offered.
Finzero Cap Ltd, registered in the Republic of Cyprus with registration number HE414308 and registered address at 62 Athalassas, Mezzanine, Strovolos 2012, Nicosia, Cyprus.
Copyright © 2024 PU Prime.

Please note the Website is intended for individuals residing in jurisdictions where accessing the Website is permitted by law.
Please note that PU Prime and its affiliated entities are neither established nor operating in your home jurisdiction.
By clicking the "Acknowledge" button, you confirm that you are entering this website solely based on your initiative and not as a result of any specific marketing outreach. You wish to obtain information from this website which is provided on reverse solicitation in accordance with the laws of your home jurisdiction.
Thank You for Your Acknowledgement!
Ten en cuenta que el sitio web está destinado a personas que residen en jurisdicciones donde el acceso al sitio web está permitido por la ley.
Ten en cuenta que PU Prime y sus entidades afiliadas no están establecidas ni operan en tu jurisdicción de origen.
Al hacer clic en el botón "Aceptar", confirmas que estás ingresando a este sitio web por tu propia iniciativa y no como resultado de ningún esfuerzo de marketing específico. Deseas obtener información de este sitio web que se proporciona mediante solicitud inversa de acuerdo con las leyes de tu jurisdicción de origen.
Thank You for Your Acknowledgement!

