PU Prime App
Exclusive deals on mobile


PU Prime App
Exclusive deals on mobile
一手掌握全球市场
我们的交易APP与大多数智能设备系统兼容。现在就下载该应用,即刻享受在任意设备上随时随地开展交易的乐趣。


8 May 2023,05:52
Daily Market Analysis
8 May 2023, 05:52


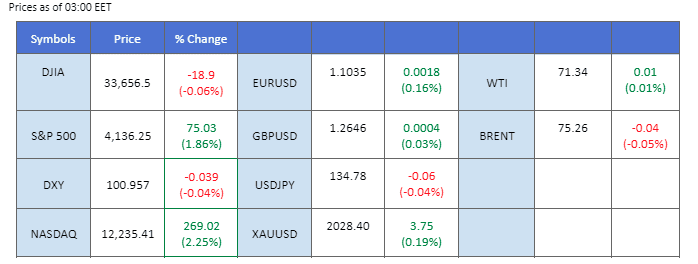
The Non-Farm Payroll (NFP) reading was in line with expectations, showing a substantial increase from the previous reading of 165,000 to 253,000. This suggests that the job market in the United States remains strong, indicating a robust economy. The equity market responded positively to this economic data and closed higher, resulting in a decrease in safe-haven gold prices. However, despite the positive NFP reading, the US dollar index did not show a significant increase due to ongoing banking issues, which have hindered the Federal Reserve from raising rates aggressively to combat inflation. Additionally, oil prices have rebounded, likely due to the strength of the US economy and the intensifying geopolitical tensions between Russia and Ukraine, which have stimulated black gold prices.
Current rate hike bets on 14th June Fed interest rate decision:
Source: CME Fedwatch Tool
0 bps (90.4%) VS 25 bps (9.6%)
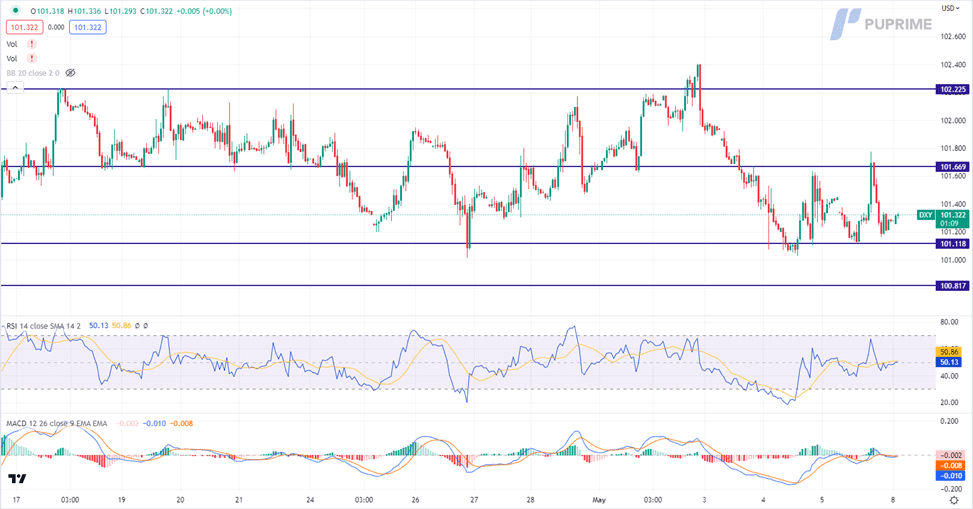
The US Dollar experienced a modest rebound last week, propelled by a wave of upbeat economic data that exceeded expectations. Nonfarm payrolls in the United States witnessed an unexpected acceleration in the previous month, outperforming economists’ projections and instilling a renewed sense of optimism for the nation’s economy. Furthermore, the US unemployment rate demonstrated a favourable decline, settling at an impressive 3.4%, far better than the market forecast of 3.60%. As market participants eagerly await the release of April’s inflation data in the United States, anticipation looms large. Economists are closely monitoring the core consumer price index, in anticipation of a year-over-year increase of 5.5%.
The Dollar Index is trading higher following the prior rebound from the support level. MACD has illustrated diminishing bearish momentum. However, RSI is at 50, suggesting the index might consolidate within a range since the RSI is near the midline.
Resistance level: 101.65, 102.25
Support level: 101.10, 100.80
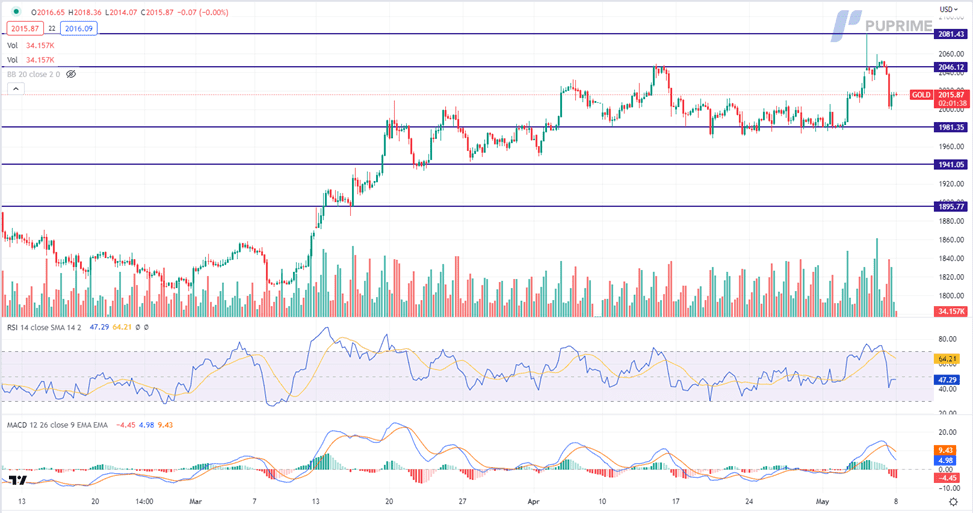
The release of impressive employment figures triggered a surge in two-year Treasury yields as investors reassessed the likelihood of future rate hikes by the Federal Reserve. Meanwhile, the US Dollar experienced a slight rebound, and gold prices tumbled from their all-time high as receding recession risks prompted investors to shift their portfolios towards riskier assets.
Gold prices are trading lower following the prior retracement from the resistance level. MACD has illustrated increasing bearish momentum, while RSI is at 47, suggesting the commodity might extend its losses toward support level at 1980.00.
Resistance level: 2045.00, 2080.00
Support level: 1980.00, 1940.00
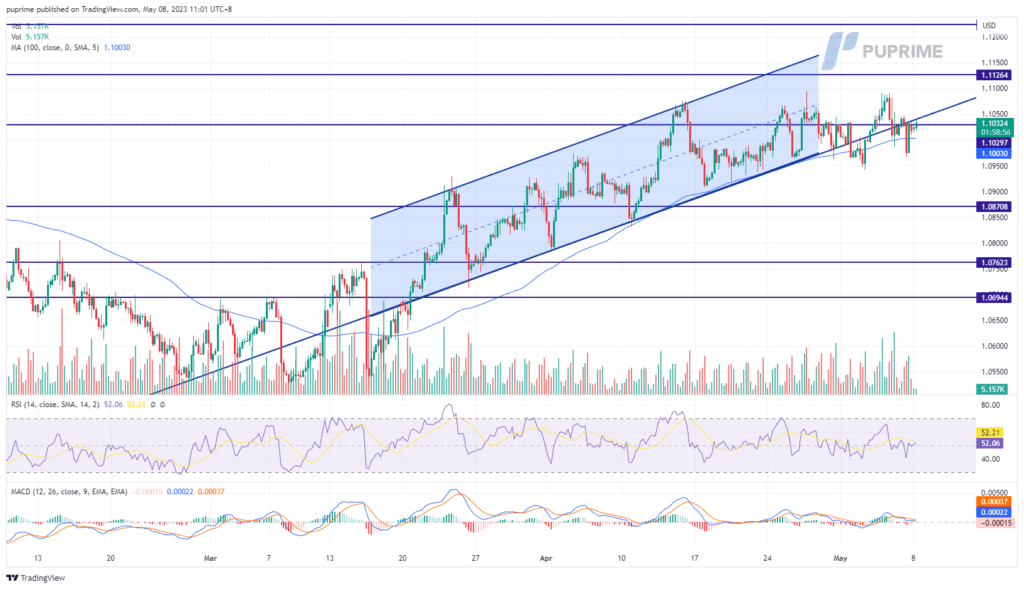
The NonFarm Payroll released last Friday showed that the Job market remains hot in the U.S. The higher-than-expected reading could not stimulate the Dollar to trade higher, perhaps due to the renewed banking woes. Banks in the U.S. are facing a credit crunch resulting from a steep interest rate hike introduced by the Fed since last year; the Fed now has to monitor the outcome of its aggressive monetary tightening program. On the other hand, ECB officials continue to signal for more rate hikes in the future but the impact of the interest rate hike from ECB in the past week was limited.
The euro is trading in an uptrend manner but the bullish momentum seems diminishing. The RSI has been hovering near the 50-level from above while the MACD is moving toward the zero line from above, suggesting a bullish momentum slow down.
Resistance level: 1.1126, 1.1225
Support level: 1.0871, 1.0762
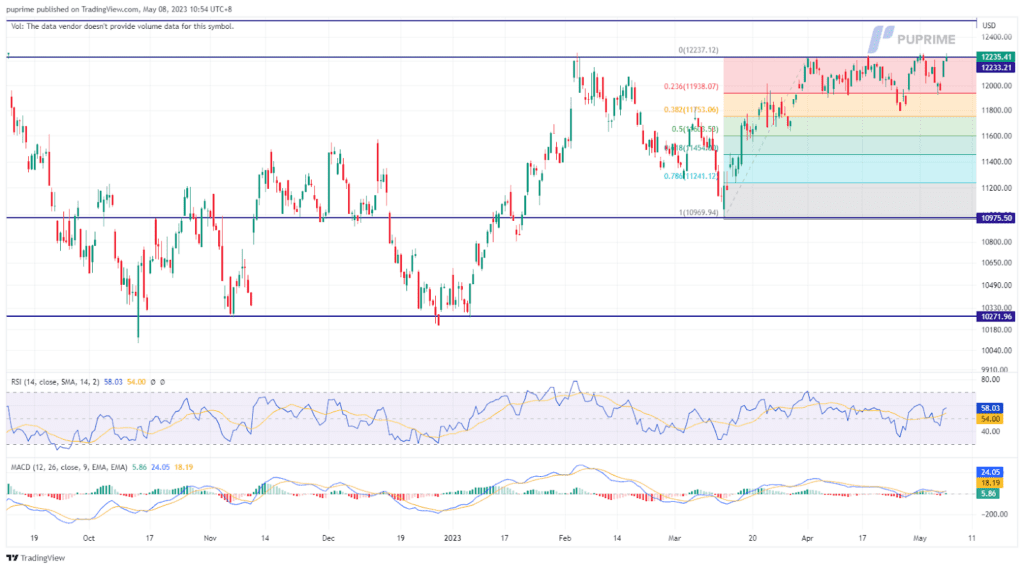
In a positive turn for the U.S. stock market, the Nasdaq Composite rose by an impressive 2.25% on Friday, adding 269.02 points to close at 12,235.41. The stellar performer was Apple Inc (AAPL.O), whose recent quarterly report buoyed investor sentiment and significantly boosted the index. In addition, the non-farms payroll report released on Friday demonstrated an encouraging upswing in the labour market. U.S. employers added 253,000 new jobs in April, exceeding expectations and the March figures of 165,000 jobs. The U.S. economy may be entering a period of sustained recovery, providing a glimmer of hope for investors and businesses alike.
The trend for the stock market is moving upward to its resistance level of 12300 points, which is a crucial area for investors to monitor closely for a possible breakout. MACD indicator suggests a bullish momentum for the market. Meanwhile, the RSI is 58, indicating that the market is currently in a slightly bullish territory but not yet overbought.
Resistance level: 12237, 12536
Support level: 11938, 11753
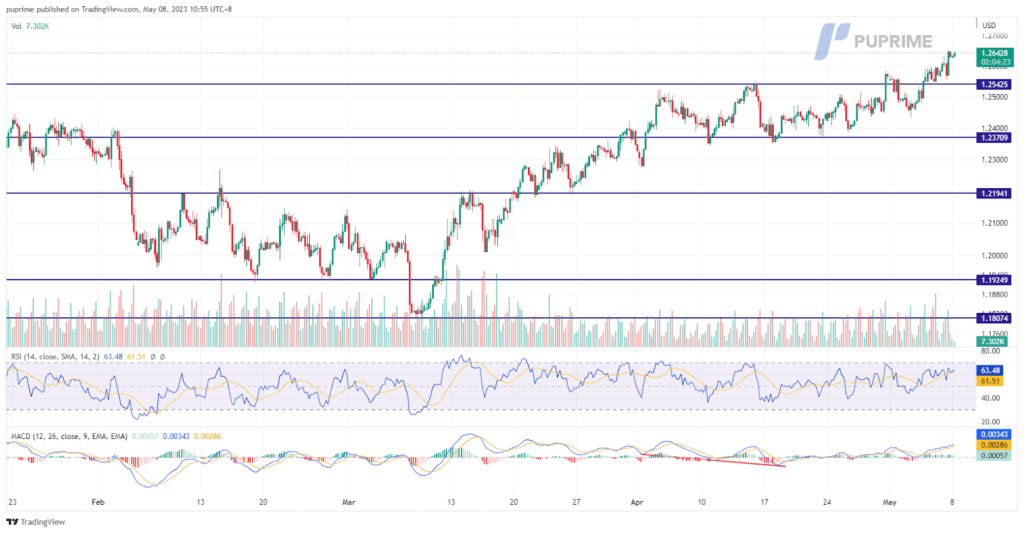
On Friday, the British pound climbed to a one-year high against the U.S. dollar as investors anticipated the Bank of England’s upcoming interest rate decision. Sterling reached $1.2652, the highest level since May 2020. The pound has received a boost from the recent U.S. Federal Reserve meeting, during which the central bank raised rates by 25 basis points but hinted that it might not continue doing so. Conversely, many analysts predict that the Bank of England will have to continue raising rates, given the higher inflation in Britain, which stood at 10.1% year-on-year in March compared to 5% in the United States. When interest rates in one country appear to rise while remaining flat in another, investments in the former may become more attractive, which could strengthen the currency. As the Bank of England’s decision draws nearer, investors are watching closely for signs of how the central bank may respond to the current economic climate.
The pound has surged to a one-year high against the U.S. dollar, with the MACD and RSI both signal a bullish momentum.
Resistance level: 1.2774, 1.2973
Support level: 1.2542, 1.2371
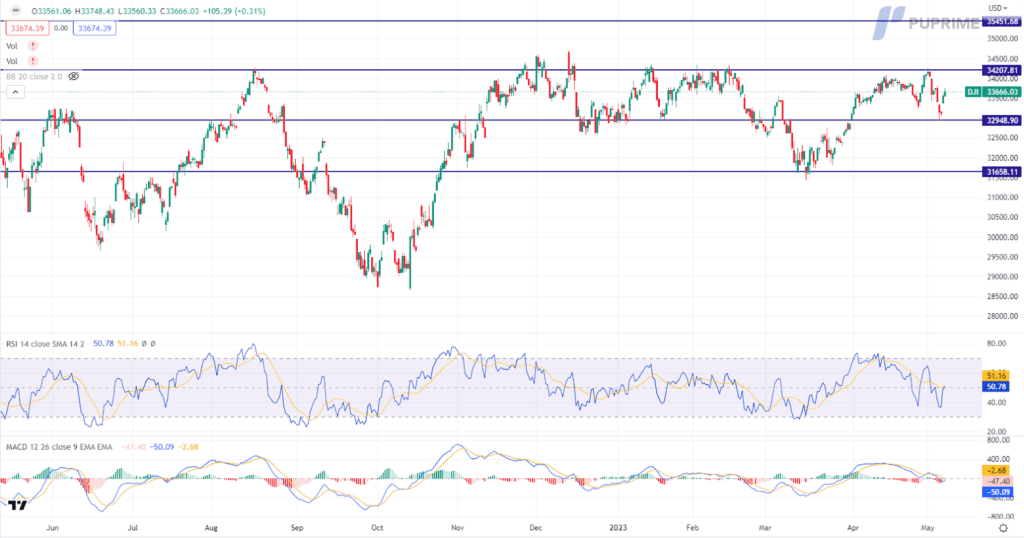
The Dow Jones Industrial Average experienced an impressive surge, gaining a remarkable 546.64 points and closing at a robust 33,674.38 last Friday. The recent market dynamics have revealed a resurgence of global risk appetite, fueled by a confluence of positive factors. The release of an encouraging jobs report and Apple’s exceptional quarterly earnings provided a powerful impetus for the market’s bullish trajectory. Simultaneously, the rebound of regional banking shares demonstrated investors’ confidence in banking sectors. As for now, investors are advised to continue monitoring the US inflation data, which is due to be released later this week for further trading signals.
The Dow is trading higher following the prior rebound from the support level. MACD has illustrated diminishing bearish momentum, while RSI is at 51, suggesting the index might trade higher since the RSI rebound sharply from oversold territory.
Resistance level: 33210.00, 35450.00
Support level: 32950.00, 31660.00
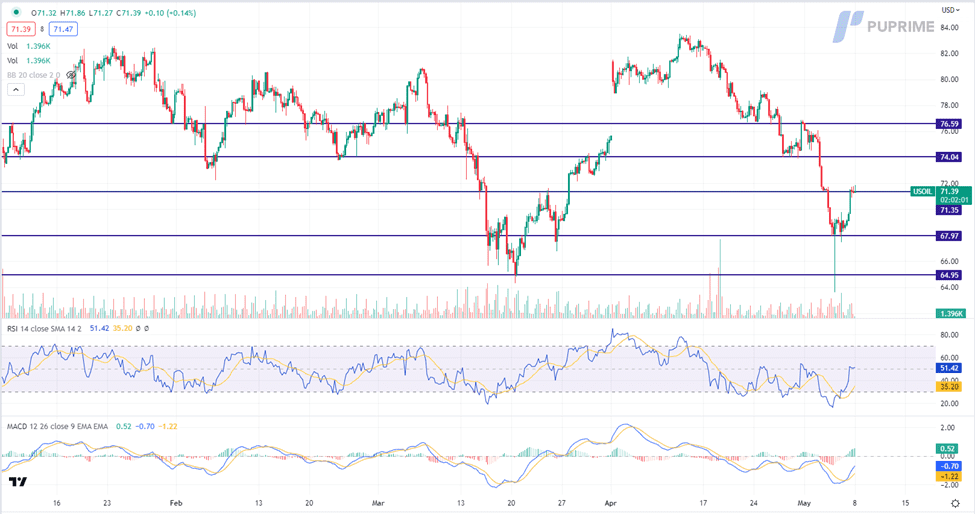
Oil prices surged following solid jobs data that alleviate concerns of a US recession. The robust growth in employment is often viewed as a positive indicator for oil, as it relies on people’s mobility and economic vibrancy for consumption. The anticipation of potential supply cuts at the forthcoming OPEC+ producer group meeting in June has further supported oil prices. Bakers Hughes reported a reduction of 3 oil rigs, bringing the count down to 588 for the current week. A decrease in the rig count suggests a potential slowdown in future oil production, potentially mitigating concerns of oversupply and contributing to a more favourable market environment for oil prices.
Oil prices are trading higher while currently testing the resistance level. MACD has illustrated increasing bullish momentum, while RSI is at 51, suggesting the commodity might extend its gains after successfully breakout since the RSI stays above the midline.
Resistance level: 71.50, 74.05
Support level: 68.00, 65.00

以行业低点差和闪电般的执行速度交易外汇、指数、贵金属等。
PU Prime App - 让您优越交易


Risk Warning: Trading Contract for Difference (CFD) carries a high level of risk to your capital and may result in losses that exceed your deposits due to leverage. It's important to understand how CFDs work and assess whether you can afford the high risk of losing your money. When acquiring our derivative products, you do not own or have rights in the underlying assets. Past performance is not indicative of future results. The information on this website is general and does not take into account your personal objectives, financial circumstances, or needs. Seek independent advice from qualified experts if necessary, and ensure you fully understand the risks before making any trading decisions.
PU Prime is a brand name of different entities authorised and registered in various jurisdictions.
PU Prime Limited is authorized and regulated by the Financial Services Authority of Seychelles under License No. SD050, with registered address at CT House, Office 1A, Providence, Mahe, Seychelles.
PU Prime Ltd is authorized and regulated by the Financial Services Commission of Mauritius under License No. GB23202672, with registered address at Suite 201 Level 2, The Catalyst Building, 40 Silicon Avenue, Cybercity Ebene, Mauritius.
PU Prime (Pty) Ltd is an authorised Financial Services Provider registered and regulated by the Financial Sector Conduct Authority of South Africa under License No. 52218, with registered address at 37 Harley Street, Ferndale, Randburg, Gauteng, South Africa.
The information on this website is not intended for residents of certain jurisdictions, including the United States, Singapore, Australia, China, Russia, and jurisdictions listed on the FATF and EU/UN sanctions lists. It is not intended for distribution or use where such distribution or use would be contrary to local law or regulation. While the Authority has granted a securities or derivatives investment business licence to the Licensee, it does not endorse the products offered.
Finzero Cap Ltd, registered in the Republic of Cyprus with registration number HE414308 and registered address at 62 Athalassas, Mezzanine, Strovolos 2012, Nicosia, Cyprus.
Copyright © 2024 PU Prime.

Please note the Website is intended for individuals residing in jurisdictions where accessing the Website is permitted by law.
Please note that PU Prime and its affiliated entities are neither established nor operating in your home jurisdiction.
By clicking the "Acknowledge" button, you confirm that you are entering this website solely based on your initiative and not as a result of any specific marketing outreach. You wish to obtain information from this website which is provided on reverse solicitation in accordance with the laws of your home jurisdiction.
Thank You for Your Acknowledgement!
Ten en cuenta que el sitio web está destinado a personas que residen en jurisdicciones donde el acceso al sitio web está permitido por la ley.
Ten en cuenta que PU Prime y sus entidades afiliadas no están establecidas ni operan en tu jurisdicción de origen.
Al hacer clic en el botón "Aceptar", confirmas que estás ingresando a este sitio web por tu propia iniciativa y no como resultado de ningún esfuerzo de marketing específico. Deseas obtener información de este sitio web que se proporciona mediante solicitud inversa de acuerdo con las leyes de tu jurisdicción de origen.
Thank You for Your Acknowledgement!

